

How to optimize Indian stocks divident yields using Python and ChatGPT?:
How do you like to optimize some well-known Indian stocks dividend yields with some conservative estimates? I have taken a bunch of popular Indian stocks with good dividend yields. Disclaimer: This is ONLY FOR ACADEMIC PURPOSES. USE IT AT YOUR OWN RISK.
One way of doing this would be to ask ChatGPT with the following prompt:
Think of yourself as a python expert and create a model to optimize an investment of INR 20,00000 into the following stocks. Look at the next 2 years and assume a linear yield. This is the list of stocks with their dividends:
Symbol |Current Price | Date | Dividend
GMDCLTD.NS 475.3 2024/01/20 30
NATIONALUM.NS 135.4 2024/01/20 10
MOIL.NS 336.95 2024/01/20 40
HINDZINC.NS 315 2024/01/20 25
VEDL.NS 264.75 2024/01/20 15
NMDC.NS 213.5 2024/01/20 10
TATASTEEL.NS 133.9 2024/01/20 5
POWERGRID.NS 237.1 2024/01/20 15
COALINDIA.NS 399 2024/01/20 20
BANKBARODA.NS 233.3 2024/01/20 12
GPPL.NS 162.5 2024/01/20 7
GAIL.NS 166.15 2024/01/20 12
SAIL.NS 114.8 2024/01/20 8
NTPC.NS 309.05 2024/01/20 22
ChatGPT ran with the prompt and produced the following output:
import matplotlib.pyplot as plt

import matplotlib.ticker as mtick
# Stock data

stocks = [

{"symbol": "GMDCLTD.NS", "current_price": 475.3, "dividend": 30},

{"symbol": "NATIONALUM.NS", "current_price": 135.4, "dividend": 10},

{"symbol": "MOIL.NS", "current_price": 336.95, "dividend": 40},

{"symbol": "HINDZINC.NS", "current_price": 315, "dividend": 25},

{"symbol": "VEDL.NS", "current_price": 264.75, "dividend": 15},

{"symbol": "NMDC.NS", "current_price": 213.5, "dividend": 10},

{"symbol": "TATASTEEL.NS", "current_price": 133.9, "dividend": 5},

{"symbol": "POWERGRID.NS", "current_price": 237.1, "dividend": 15},

{"symbol": "COALINDIA.NS", "current_price": 399, "dividend": 20},

{"symbol": "BANKBARODA.NS", "current_price": 233.3, "dividend": 12},

{"symbol": "GPPL.NS", "current_price": 162.5, "dividend": 7},

{"symbol": "GAIL.NS", "current_price": 166.15, "dividend": 12},

{"symbol": "SAIL.NS", "current_price": 114.8, "dividend": 8},

{"symbol": "NTPC.NS", "current_price": 309.05, "dividend": 22},

]
# Initial investment

initial_investment = 2000000
# Number of years

num_years = 2
# List to store total portfolio values for plotting

portfolio_values = []
# Calculate expected value for each stock at the end of each year with increasing dividends

for year in range(1, num_years + 1):

print(f"\nYear {year}:")
total_value = 0

for stock in stocks:

expected_price = stock["current_price"] * (1 + (year * 0.05)) # Assuming a linear yield of 5% per year

total_value += expected_price
# Increase dividends by 5% each year
stock["dividend"] = round(stock["dividend"] * 1.05)
# Include dividends
total_value += stock["dividend"]
print(f"{stock['symbol']}: Expected Price - {expected_price:,.2f}, Dividend - {stock['dividend']:,}")
 # Calculate total portfolio value at the end of the year

total_value *= initial_investment / sum(stock["current_price"] for stock in stocks)

print(f"\nTotal Portfolio Value at the end of Year {year}: {total_value:,.2f}")
# Store the portfolio value for plotting

portfolio_values.append(total_value)
# Update initial investment for the next year
initial_investment = total_value
# Plotting the portfolio values

months = list(range(12, (num_years + 1) * 12, 12))  # Corrected to match the length of portfolio_values

plt.plot(months, portfolio_values, marker='o')

plt.title('Portfolio Value Over 2 Years')
# Labeling the axes

plt.xlabel('Months')

plt.ylabel('Total Portfolio Value (INR)')
# Format the y-axis in Rupees with commas

plt.gca().yaxis.set_major_formatter(mtick.StrMethodFormatter('{x:,.0f} INR'))
# Add grid for better readability
plt.grid(True)
# Show the plot
plt.show()
As a first approximation I thought this chart output was good. Then I realized we can make our analysis more user-friendly with the following prompt:
This was useful. Please calculate the yields with an increase in dividends by 5% each year and redo the script. Can you plot the above data frame using matplotlib? Then finally, make the chart user-friendly with making Y axis and X axis with human-readable values, in Rupees and Months, respectively.
After this prompt we get:
import matplotlib.pyplot as plt

import matplotlib.ticker as mtick
# Stock data

stocks = [

{"symbol": "GMDCLTD.NS", "current_price": 475.3, "dividend": 30},

{"symbol": "NATIONALUM.NS", "current_price": 135.4, "dividend": 10},

{"symbol": "MOIL.NS", "current_price": 336.95, "dividend": 40},

{"symbol": "HINDZINC.NS", "current_price": 315, "dividend": 25},

{"symbol": "VEDL.NS", "current_price": 264.75, "dividend": 15},

{"symbol": "NMDC.NS", "current_price": 213.5, "dividend": 10},

{"symbol": "TATASTEEL.NS", "current_price": 133.9, "dividend": 5},

{"symbol": "POWERGRID.NS", "current_price": 237.1, "dividend": 15},

{"symbol": "COALINDIA.NS", "current_price": 399, "dividend": 20},

{"symbol": "BANKBARODA.NS", "current_price": 233.3, "dividend": 12},

{"symbol": "GPPL.NS", "current_price": 162.5, "dividend": 7},

{"symbol": "GAIL.NS", "current_price": 166.15, "dividend": 12},

{"symbol": "SAIL.NS", "current_price": 114.8, "dividend": 8},

{"symbol": "NTPC.NS", "current_price": 309.05, "dividend": 22},

]
# Initial investment

initial_investment = 2000000
# Number of years
num_years = 2
# List to store total portfolio values for plotting
portfolio_values = []
# Calculate expected value for each stock at the end of each year with increasing dividends

for year in range(1, num_years + 1):

print(f"\nYear {year}:")
total_value = 0

for stock in stocks:

expected_price = stock["current_price"] * (1 + (year * 0.05)) # Assuming a linear yield of 5% per year

total_value += expected_price
# Increase dividends by 5% each year
stock["dividend"] = round(stock["dividend"] * 1.05)
# Include dividends
total_value += stock["dividend"]
print(f"{stock['symbol']}: Expected Price - {expected_price:,.2f}, Dividend - {stock['dividend']:,}")
 # Calculate total portfolio value at the end of the year

total_value *= initial_investment / sum(stock["current_price"] for stock in stocks)

print(f"\nTotal Portfolio Value at the end of Year {year}: {total_value:,.2f}")
# Store the portfolio value for plotting

portfolio_values.append(total_value)
# Update initial investment for the next year
initial_investment = total_value
# Plotting the portfolio values

months = list(range(12, (num_years + 1) * 12, 12))  # Corrected to match the length of portfolio_values

plt.plot(months, portfolio_values, marker='o')

plt.title('Portfolio Value Over 2 Years')
# Labeling the axes

plt.xlabel('Months')

plt.ylabel('Total Portfolio Value (INR)')
# Format the y-axis in Rupees with commas
plt.gca().yaxis.set_major_formatter(mtick.StrMethodFormatter('{x:,.0f} INR'))
# Add grid for better readability
plt.grid(True)
# Show the plot
plt.show()
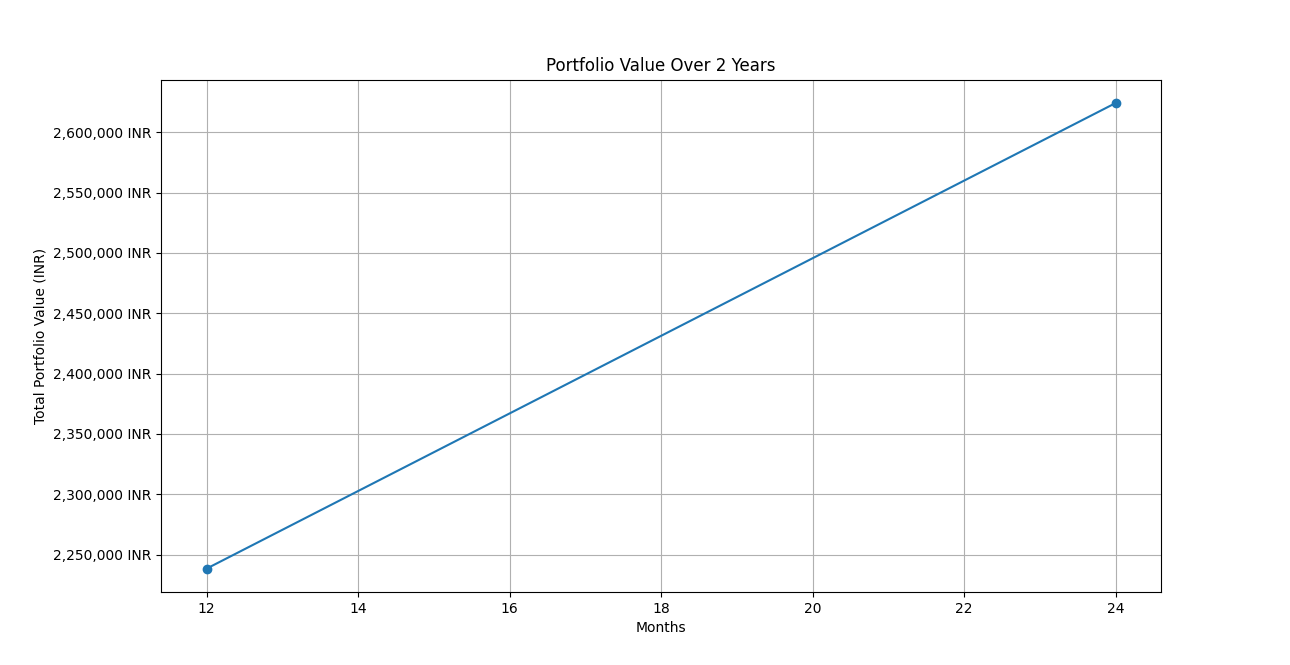
Here is the script output and chart:
Year 1:
GMDCLTD.NS: Expected Price – 499.07, Dividend – 32
NATIONALUM.NS: Expected Price – 142.17, Dividend – 10
MOIL.NS: Expected Price – 353.80, Dividend – 42
HINDZINC.NS: Expected Price – 330.75, Dividend – 26
VEDL.NS: Expected Price – 277.99, Dividend – 16
NMDC.NS: Expected Price – 224.18, Dividend – 10
TATASTEEL.NS: Expected Price – 140.59, Dividend – 5
POWERGRID.NS: Expected Price – 248.96, Dividend – 16
COALINDIA.NS: Expected Price – 418.95, Dividend – 21
BANKBARODA.NS: Expected Price – 244.97, Dividend – 13
GPPL.NS: Expected Price – 170.62, Dividend – 7
GAIL.NS: Expected Price – 174.46, Dividend – 13
SAIL.NS: Expected Price – 120.54, Dividend – 8
NTPC.NS: Expected Price – 324.50, Dividend – 23
Total Portfolio Value at the end of Year 1: 2,238,416.22
Year 2:
GMDCLTD.NS: Expected Price – 522.83, Dividend – 34
NATIONALUM.NS: Expected Price – 148.94, Dividend – 10
MOIL.NS: Expected Price – 370.65, Dividend – 44
HINDZINC.NS: Expected Price – 346.50, Dividend – 27
VEDL.NS: Expected Price – 291.23, Dividend – 17
NMDC.NS: Expected Price – 234.85, Dividend – 10
TATASTEEL.NS: Expected Price – 147.29, Dividend – 5
POWERGRID.NS: Expected Price – 260.81, Dividend – 17
COALINDIA.NS: Expected Price – 438.90, Dividend – 22
BANKBARODA.NS: Expected Price – 256.63, Dividend – 14
GPPL.NS: Expected Price – 178.75, Dividend – 7
GAIL.NS: Expected Price – 182.77, Dividend – 14
SAIL.NS: Expected Price – 126.28, Dividend – 8
NTPC.NS: Expected Price – 339.96, Dividend – 24
Total Portfolio Value at the end of Year 2: 2,624,216.06