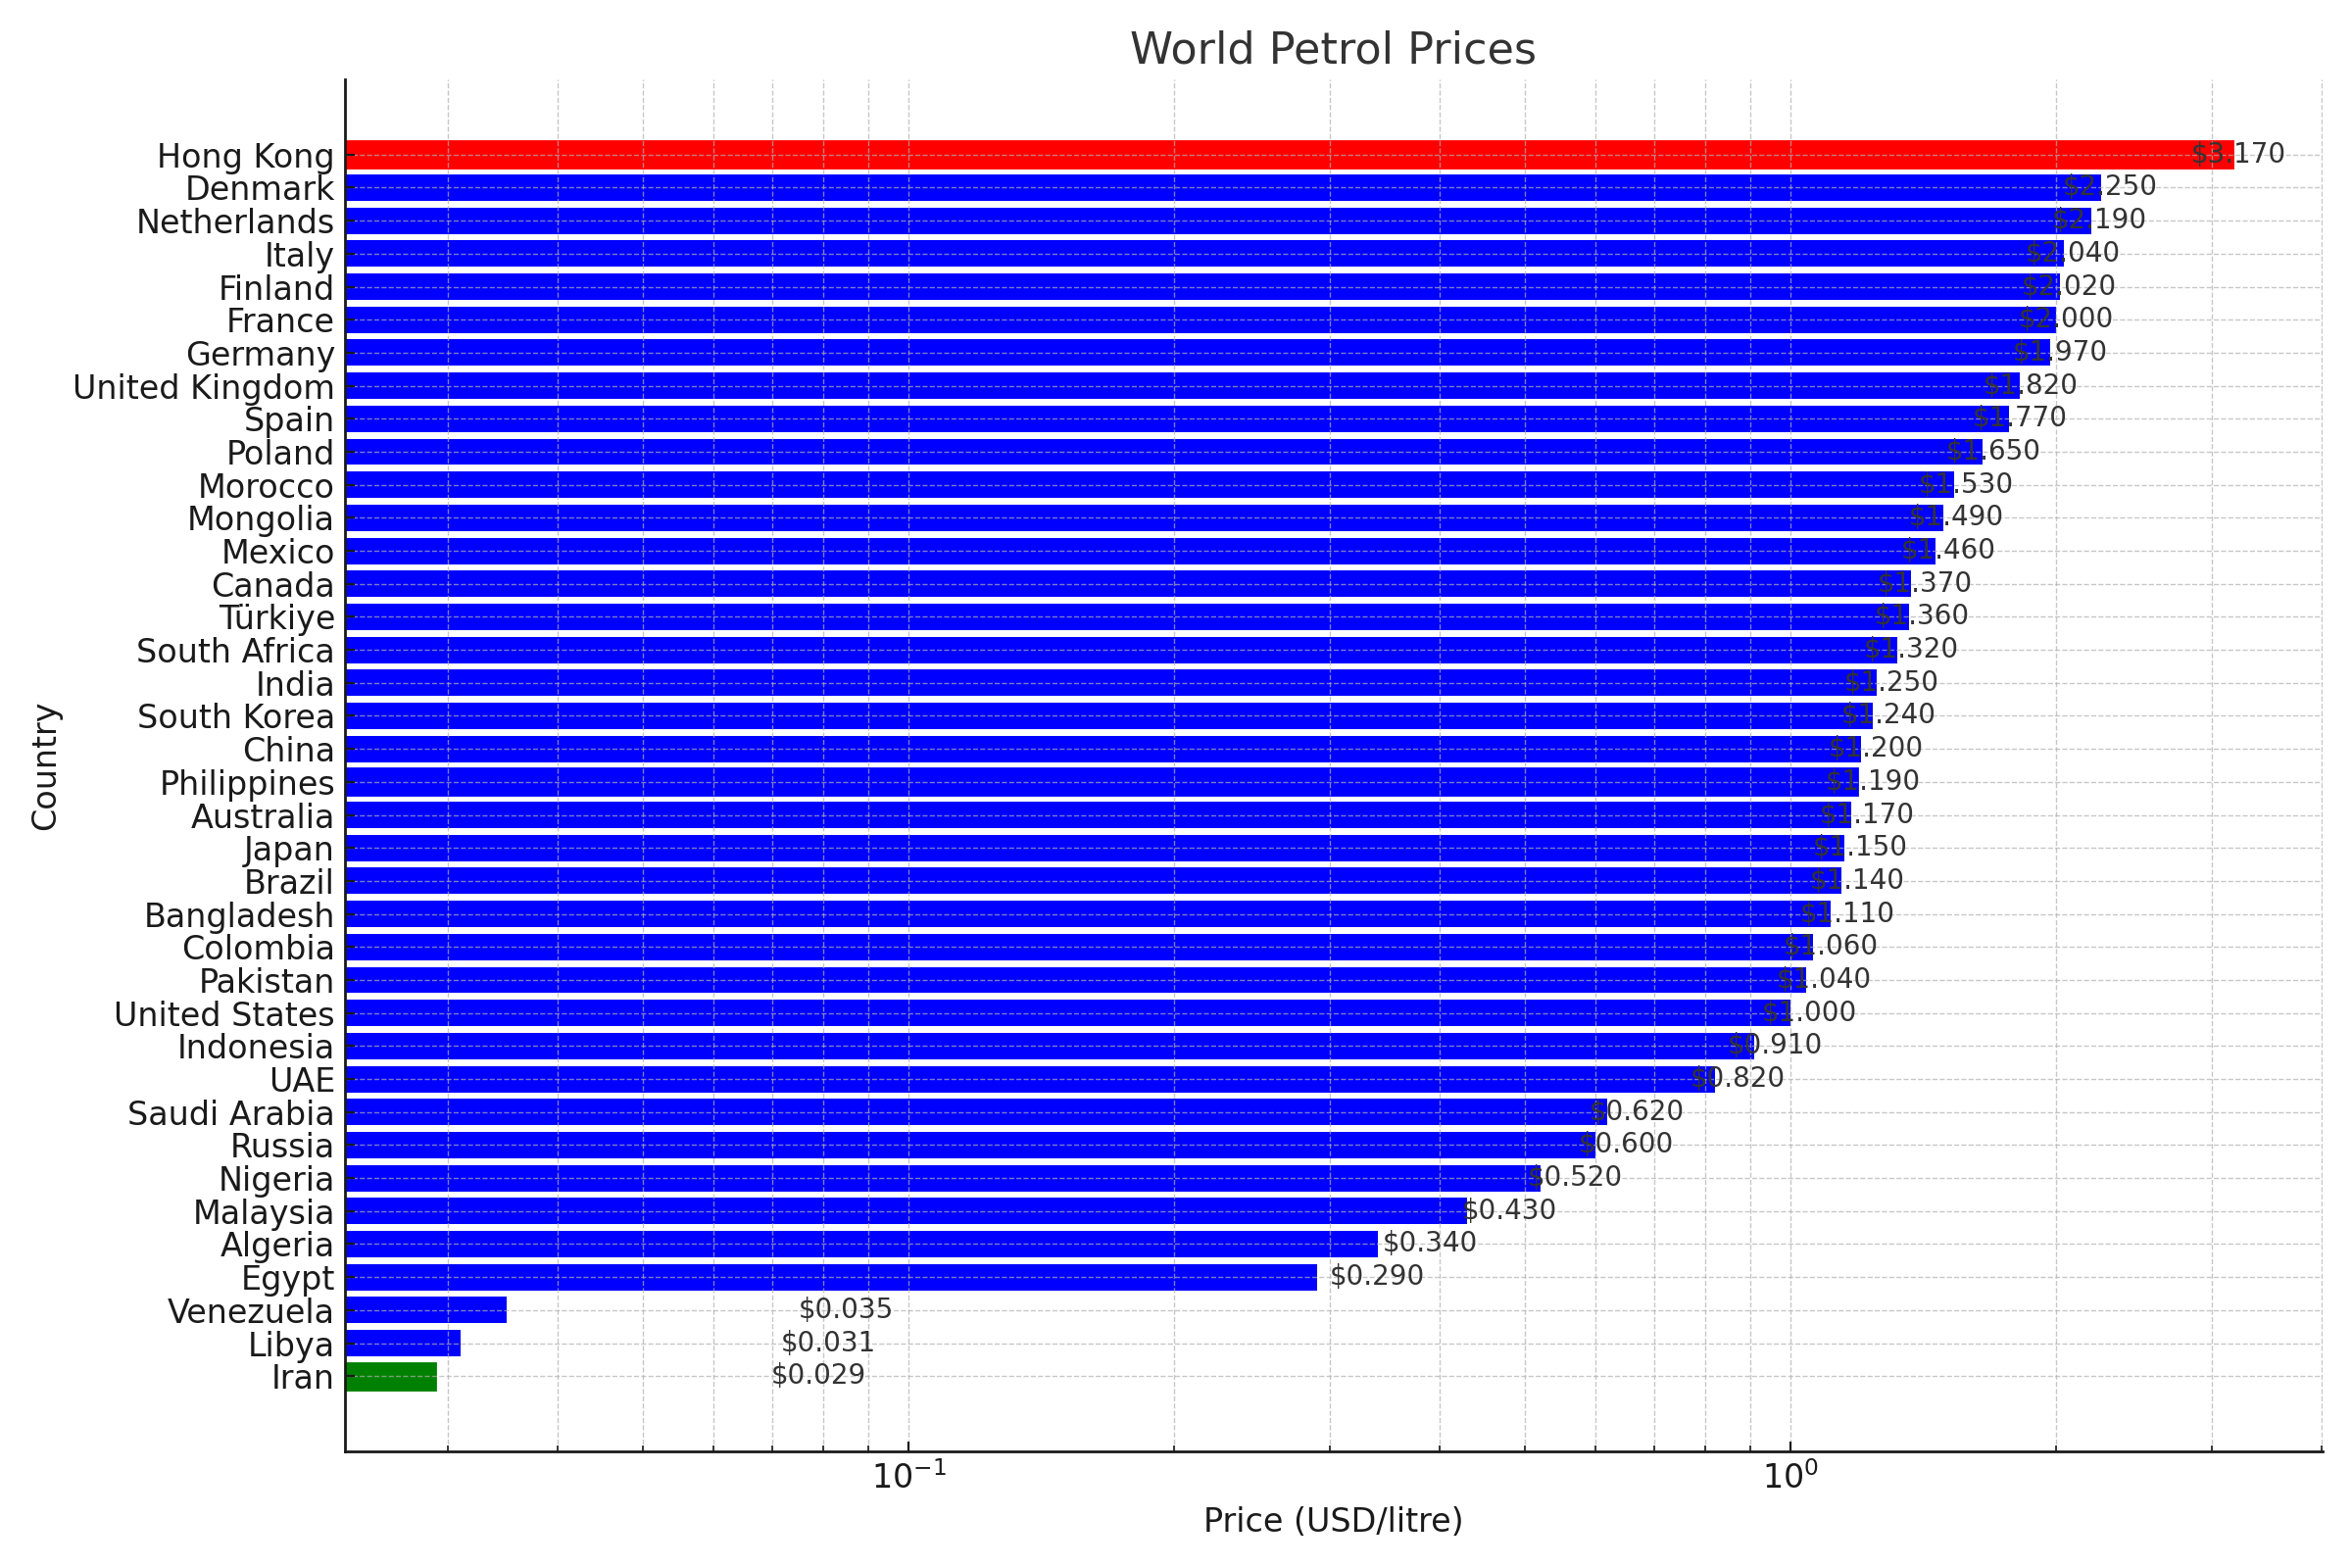
This is the world petrol prices data taken from Twitter. Is there a simple way we can assess how the petrol prices stack up in different countries across the globe. We can use ChatGPT and some Python to accomplish this analysis. Here is the prompt:
Think of yourself as an ace in Python and data analysis to convert this data into a pandas dataframe as wpp.csv and plot the data using matplotlib with log values on ‘X’ axis:
🚗 Gasoline (Petrol) prices:
- 🇮🇷 Iran: $0.029 (litre, US$)
- 🇱🇾 Libya: $0.031
- 🇻🇪 Venezuela: $0.035
- 🇪🇬 Egypt: $0.29
- 🇩🇿 Algeria: $0.34
- 🇲🇾 Malaysia: $0.43
- 🇳🇬 Nigeria: $0.52
- 🇷🇺 Russia: $0.60
- 🇸🇦 Saudi Arabia: $0.62
- 🇦🇪 UAE: $0.82
- 🇮🇩 Indonesia: $0.91
- 🇺🇸 United States: $1.00
- 🇵🇰 Pakistan: $1.04
- 🇨🇴 Colombia: $1.06
- 🇧🇩 Bangladesh: $1.11
- 🇧🇷 Brazil: $1.14
- 🇯🇵 Japan: $1.15
- 🇦🇺 Australia: $1.17
- 🇵🇭 Philippines: $1.19
- 🇨🇳 China: $1.20
- 🇰🇷 South Korea: $1.24
- 🇮🇳 India: $1.25
- 🇿🇦 South Africa: $1.32
- 🇹🇷 Turkey: $1.36
- 🇨🇦 Canada: $1.37
- 🇲🇽 Mexico: $1.46
- 🇲🇳 Mongolia: $1.49
- 🇲🇦 Morocco: $1.53
- 🇵🇱 Poland: $1.65
- 🇪🇸 Spain: $1.77
- 🇬🇧 United Kingdom: $1.82
- 🇩🇪 Germany: $1.97
- 🇫🇷 France: $2.00
- 🇫🇮 Finland: $2.02
- 🇮🇹 Italy: $2.04
- 🇳🇱 Netherlands: $2.19
- 🇩🇰 Denmark: $2.25
- 🇭🇰 Hong Kong: $3.17
You can see from the chart that Hong Kong pays the highest for petrol at $3.17 per liter while Iran consumers pay just $0.029 per liter.


